
Measure repair cycle time
The Cycle Time screen shows how long vehicles took to move between two dates or production statuses, for example from Body to Paint, during a period you choose.
Cycle time counts only folders that are repairs. A folder becomes a repair when a work order is created. Total losses (disposition TOTAL) and folders without a work order (disposition NONE), such as lost opportunities, are left out.
Open the Cycle Time screen
Section titled “Open the Cycle Time screen”- On the Operations tab, in the Analytics group, select Cycle Time.
- Choose your filters at the top of the screen. You must choose a Cycle Begin Date, a Cycle End Date, and a date range (a Period, or From and Thru dates).
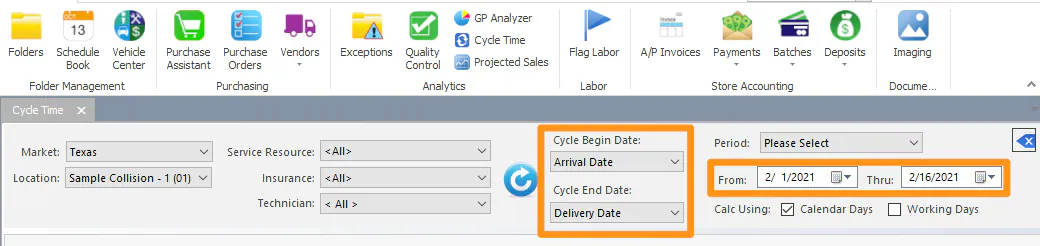
Choose the begin and end dates
Section titled “Choose the begin and end dates”The Cycle Begin Date and Cycle End Date lists include the standard Nexsyis dates, such as Date of Loss, Arrival Date, Customer Autho, Insurance Autho, InProcess Date, Completed Date and Delivery Date. The entries in between are your company’s own production statuses.
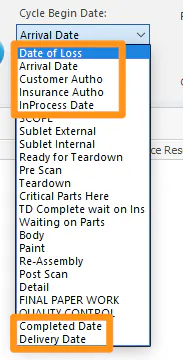
Example: average Body cycle time this month
Section titled “Example: average Body cycle time this month”-
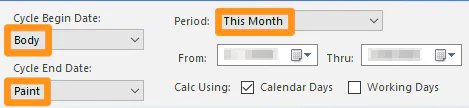
Set Cycle Begin Date to Body.
-
Set Cycle End Date to Paint.
-
Set Period to This Month.
-
Select Refresh.
The grid lists every vehicle that came through the shop in that period and passed through those statuses. The totals at the bottom include the folder count, total hours, average hours, total sales, total and average days, and hours per day (HPD).
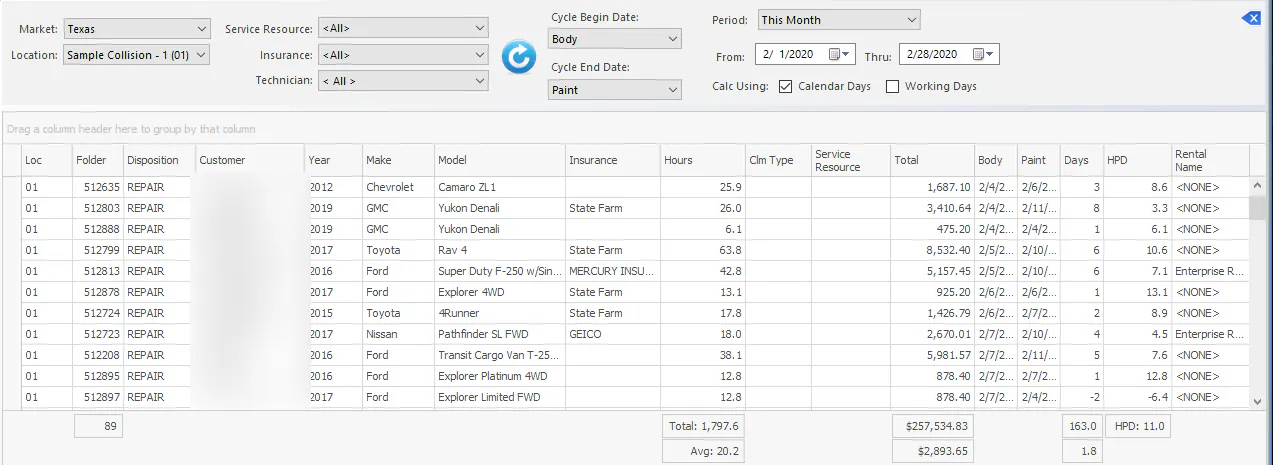
To count only working days instead of calendar days, select Working Days next to Calc Using.
Cycle Time Report
Section titled “Cycle Time Report”You can also run the Cycle Time Report from the Reports menu. Its Arrive To Start column shows the time from the arrival date to the date the vehicle moved into the first stage after arrival.
