
Use the Sales dashboard
The Sales dashboard in NexsyisNow shows what you’ve invoiced, how sales break down by sales code and resource, and which vehicle makes bring in the most sales.
Before you begin
Section titled “Before you begin”You need the Allow access to the Sales Dashboard transaction permission.
Open the dashboard
Section titled “Open the dashboard”- In NexsyisNow, select the dashboard icon in the left menu.
- Select the Sales tab.
- Choose a time frame: Today, This Week, This Month or This Year.
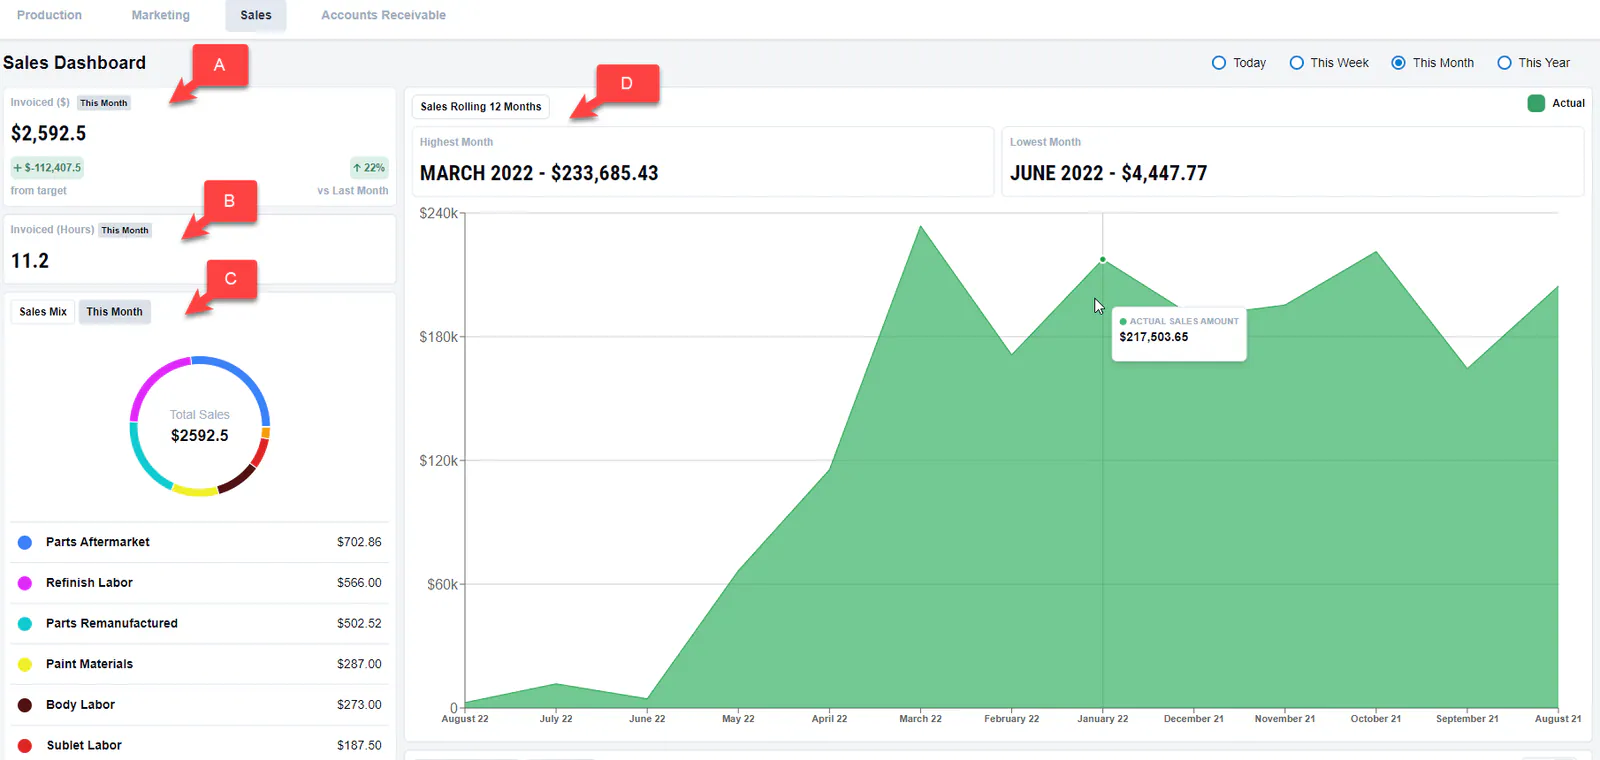
What the dashboard shows
Section titled “What the dashboard shows”- A. Invoiced ($): the amount invoiced, after discounts, for the time frame.
- B. Invoiced (Hours): the hours invoiced for the time frame.
- C. Sales Mix: sales for each sales code. Total Sales is the amount before discounts.
- D. Sales Rolling 12 Months: sales for each of the past 12 months, with the highest and lowest month. This chart always shows the past 12 months, whatever time frame you choose. Hover over the chart to see the numbers.
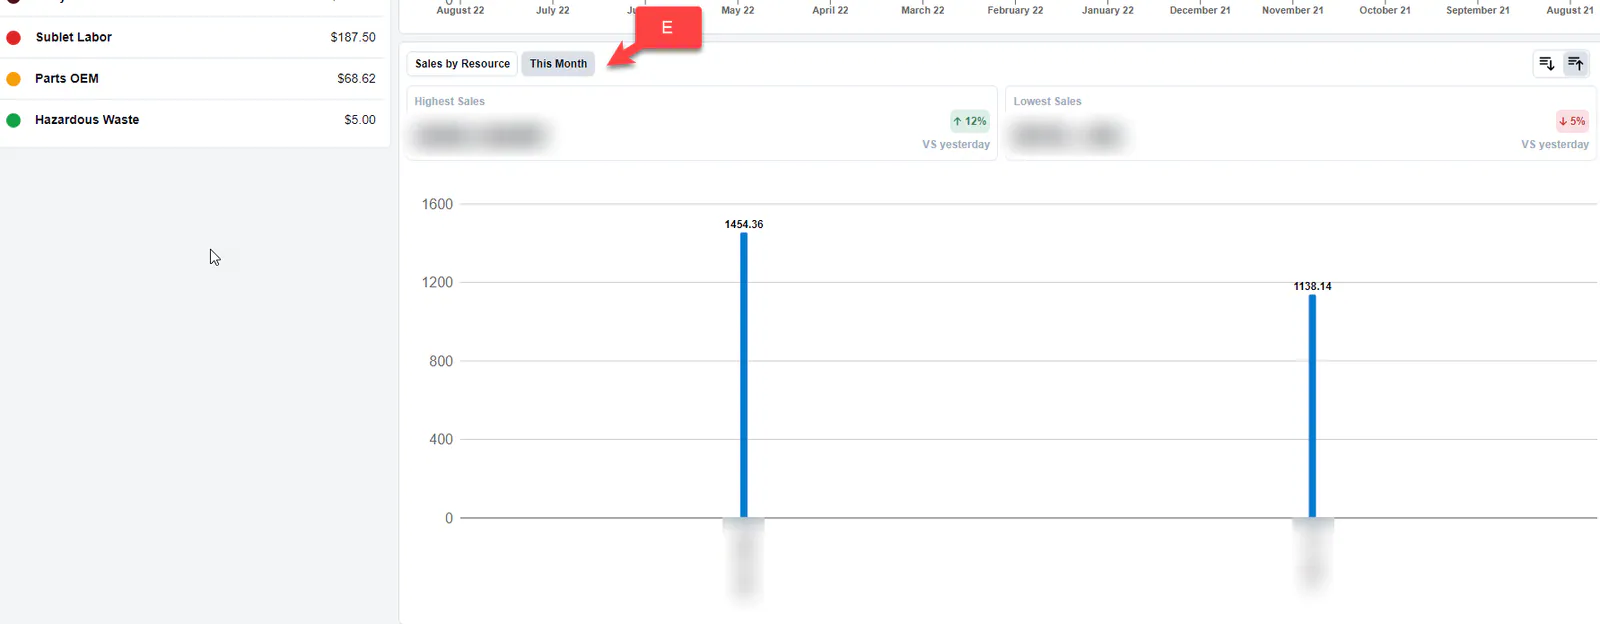
- E. Sales by Resource: sales for each resource in the time frame, with the resource with the highest sales and the resource with the lowest sales.
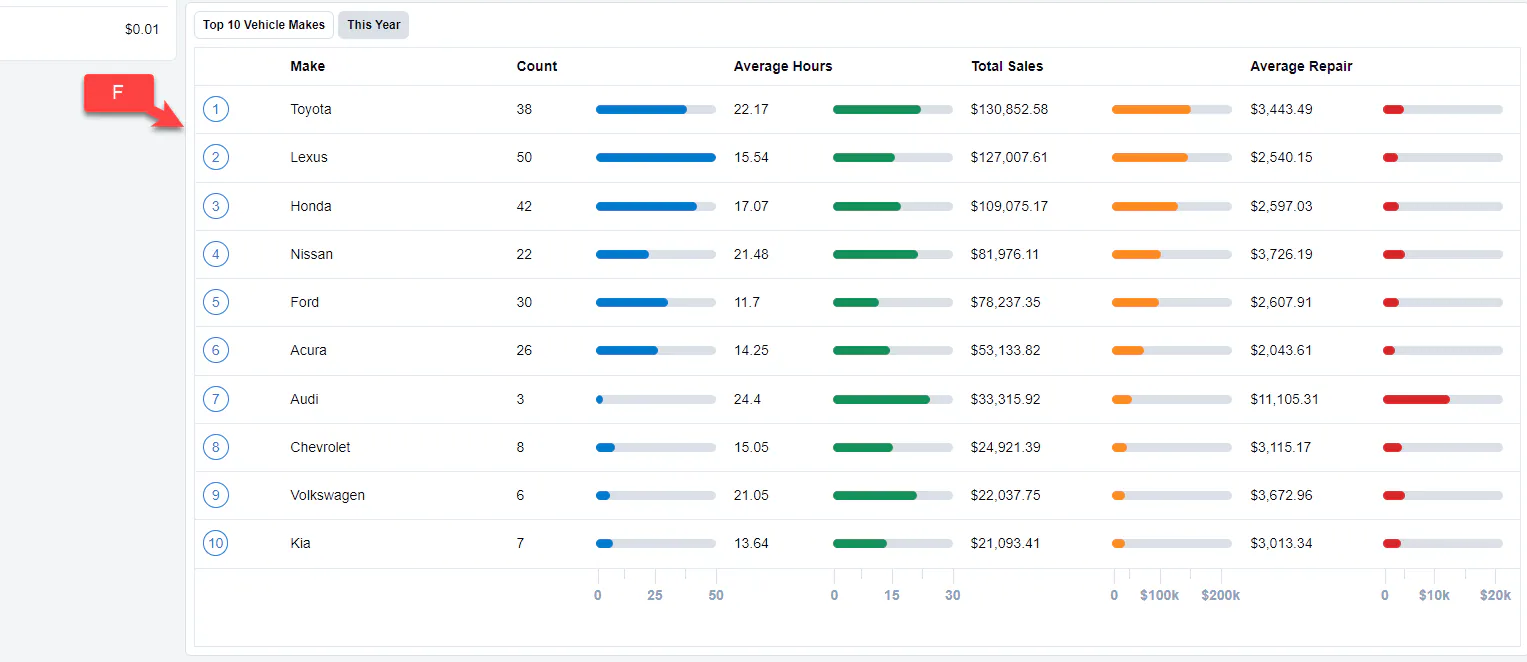
- F. Top 10 Vehicle Makes: the ten vehicle makes with the most sales in the time frame, with the count, average hours, total sales and average repair for each.