
Analyze gross profit by company or location
The Gross Profit Analyzer (GP Analyzer) breaks down cost, sales and gross profit margin by department. It lists the folders delivered and invoiced (or completed and invoiced) in a date range, with all sales and costs for those folders.
How the GP Analyzer differs from financial reports
Section titled “How the GP Analyzer differs from financial reports”The GP Analyzer is an operations and management tool, not a financial statement. It won’t match the P&L or other sales reports.
- It shows gross profit for the selected folders as of today, no matter which financial period the sales or costs were posted in. Financial statements show sales and costs in the period they were recorded.
- It includes estimated costs. Everything in the Charges section is an estimated cost, and pending credits are estimated costs or credits.
- It includes only folders that have a work order. Sales or costs on a folder without a work order show on other sales and cost reports, but not here.
Common timing differences between the GP Analyzer and the financial statements:
- A supplement written after a month was closed. The sales difference falls into the first open financial period for Sales.
- Costs (AP invoices) added to a folder after a month was closed. The difference falls into the first open financial period for Cost of Sales.
- Costs for a vehicle return are recorded in the month they happen, for example warranty work on a vehicle repaired three months earlier.
Open the GP Analyzer
Section titled “Open the GP Analyzer”-
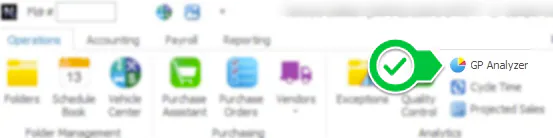
On the Operations tab, in the Analytics group, select GP Analyzer.
-
Choose the Market, Location and other filters, and the Invoiced/Completed Date range (Period, or From and Thru).
-
Select Refresh.

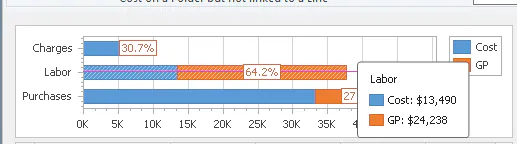
The results are split into Purchases, Labor and Charges. Hover over the chart to see the totals for each group.
Drill into the details
Section titled “Drill into the details”-
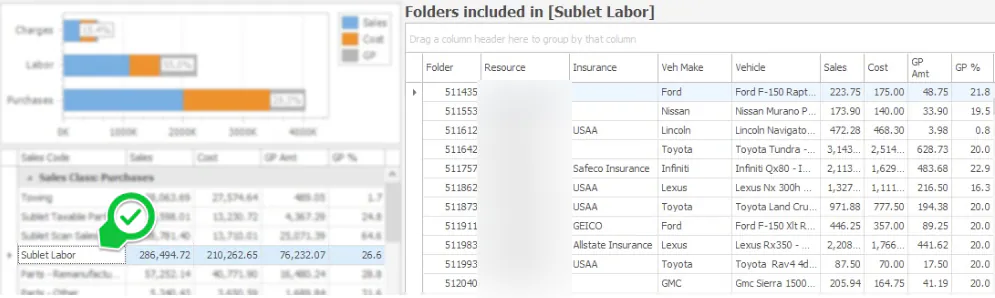
Double-click a sales code on the left. The folders for that sales code load on the right.
-
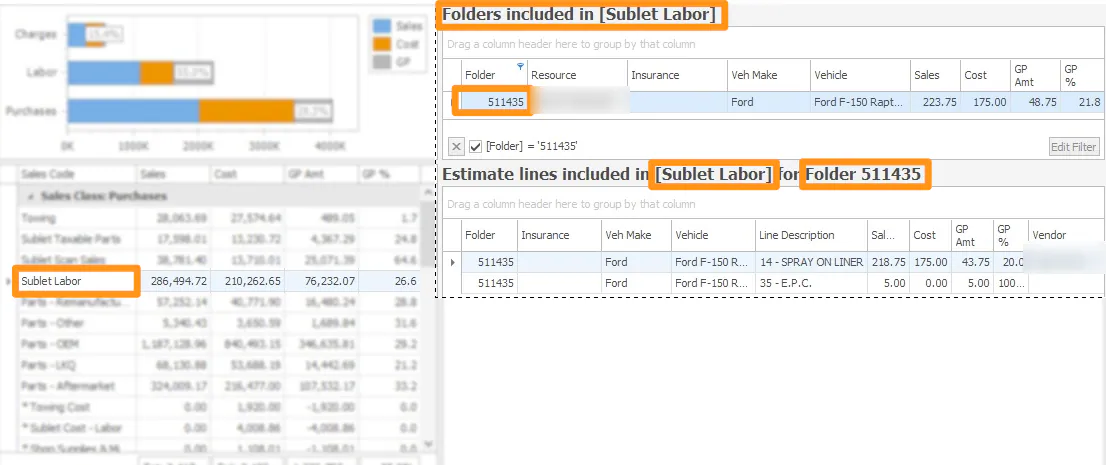
Double-click a folder, or filter the grid by folder, to see the estimate lines for that folder.
-
To go back to all folders, select the x next to the folder filter.
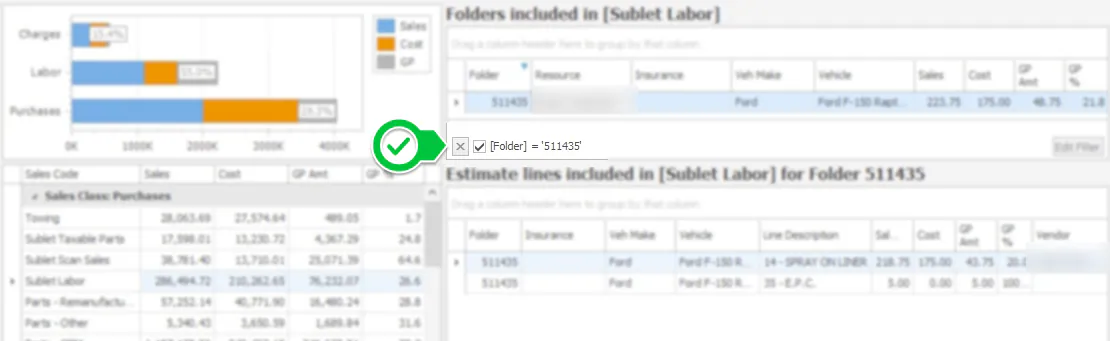
Filter by sales code, make and GP %
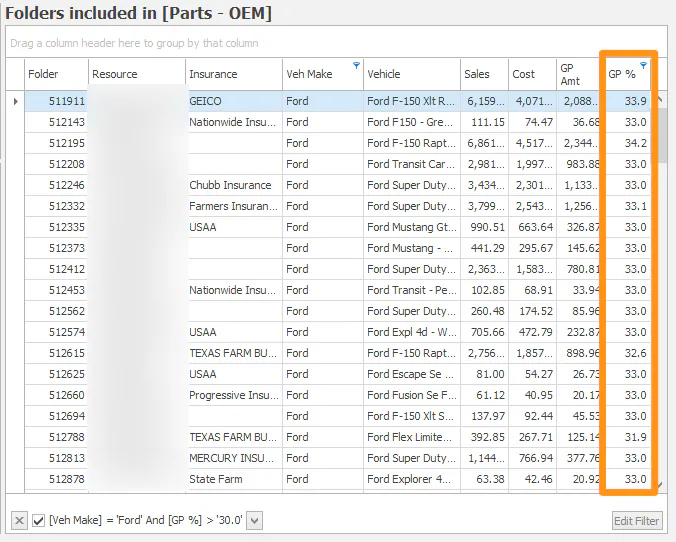
Section titled “Filter by sales code, make and GP %”For example, to show Parts - OEM for Ford with a GP % above 30%:
-
Double-click the sales code, for example Parts - OEM.
-
Use the grid filter on the Veh Make column to choose the make.
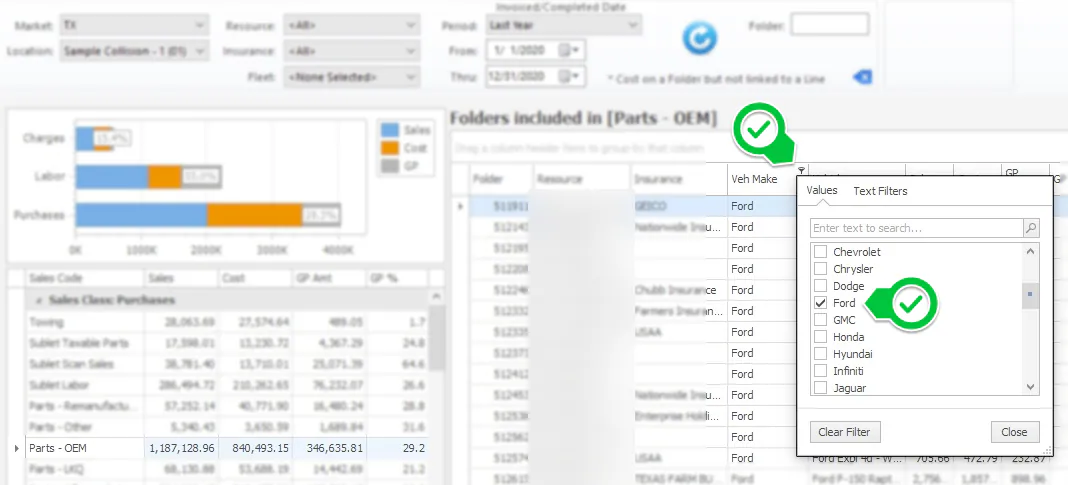
-
Select Edit Filter.
-
In the Filter Editor, choose the column, the operation and the value, for example [GP %] Is greater than 30.0, then select OK.
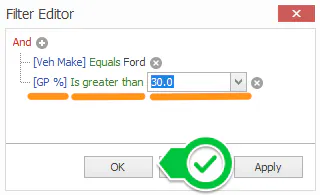
The grid shows the folders in Parts - OEM for Ford with a GP % above 30%.
Labor GP %
Section titled “Labor GP %”Labor cost doesn’t show until technicians have been flagged and paid. Labor costs come from the weekly approved flag batches. When a flag batch is approved, Nexsyis calculates the cost as the hours flagged times the pay rate in effect on that date for the person or team. The flags become cost transactions, like an AP invoice.
When you look at a single folder, the GP Analyzer also estimates the cost of hours not yet flagged, using the current pay rate. See Analyze gross profit for a folder.
Charges GP %
Section titled “Charges GP %”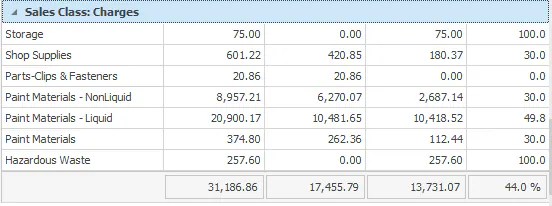
- Non-paint material charges (such as Storage and Shop Supplies): the GP % always equals the expected GP % set for the location. The GP amount and cost are calculated from that percentage.
- Paint Materials - Liquid: for folders with mixing machine data, the cost comes from the mixing machine, and the GP % is the GP amount divided by sales.
- Paint Materials - NonLiquid: for folders with mixing machine data, the GP % always equals the expected GP % for the location.
- Paint Materials: for folders without mixing machine data, the GP % always equals the expected GP % for the location.
For more about paint materials, see Paint materials and mixing machine data.
Change the expected GP % for charges
Section titled “Change the expected GP % for charges”-
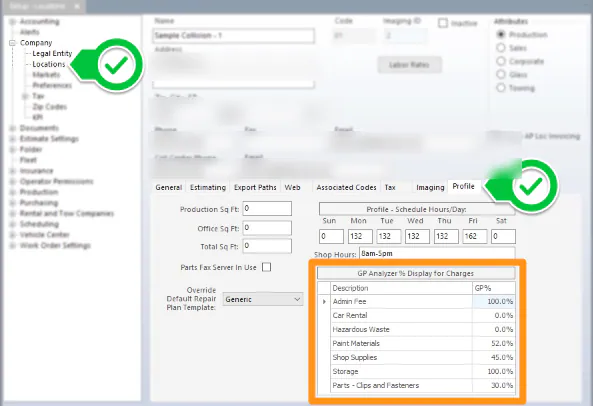
Open Settings › Setup › Company › Locations, and select a location.
-
Select the Profile tab.
-
In the GP Analyzer % Display for Charges grid at the bottom right, click in the GP% column and change the value.
-
Select Save. Changes aren’t kept until you save.
The new percentages apply in the GP Analyzer for folders at that location.