Use the Production dashboard
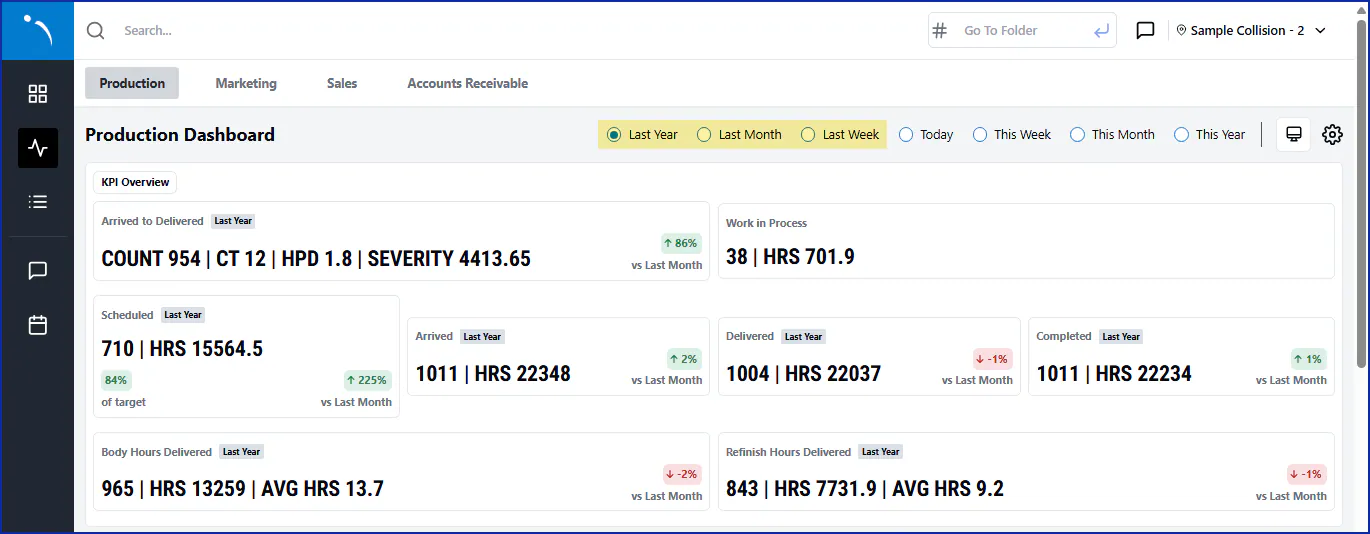
The Production dashboard in NexsyisNow shows how repairs are moving through the shop: cycle time, work in process, and the repairs and hours scheduled, arrived, delivered and completed.
Before you begin
Section titled “Before you begin”You need the Allow access to the Production Dashboard transaction permission.
Open the dashboard
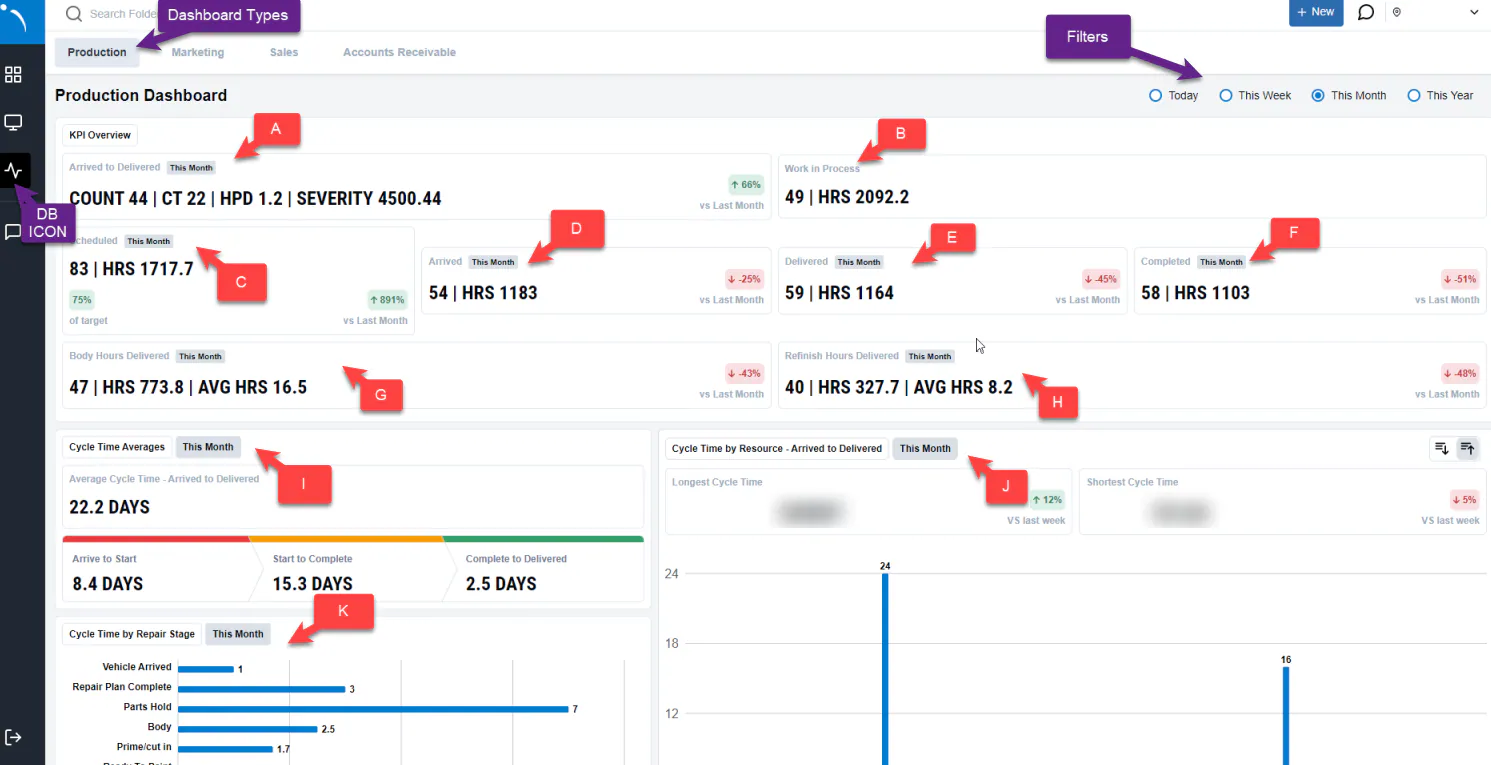
Section titled “Open the dashboard”- In NexsyisNow, select the dashboard icon in the left menu.
- Select the Production tab. The Marketing, Sales and Accounts Receivable tabs open the other dashboards.
- Choose a time frame: Today, This Week, This Month or This Year.
Everything on the dashboard is based on the time frame you choose.
What the dashboard shows
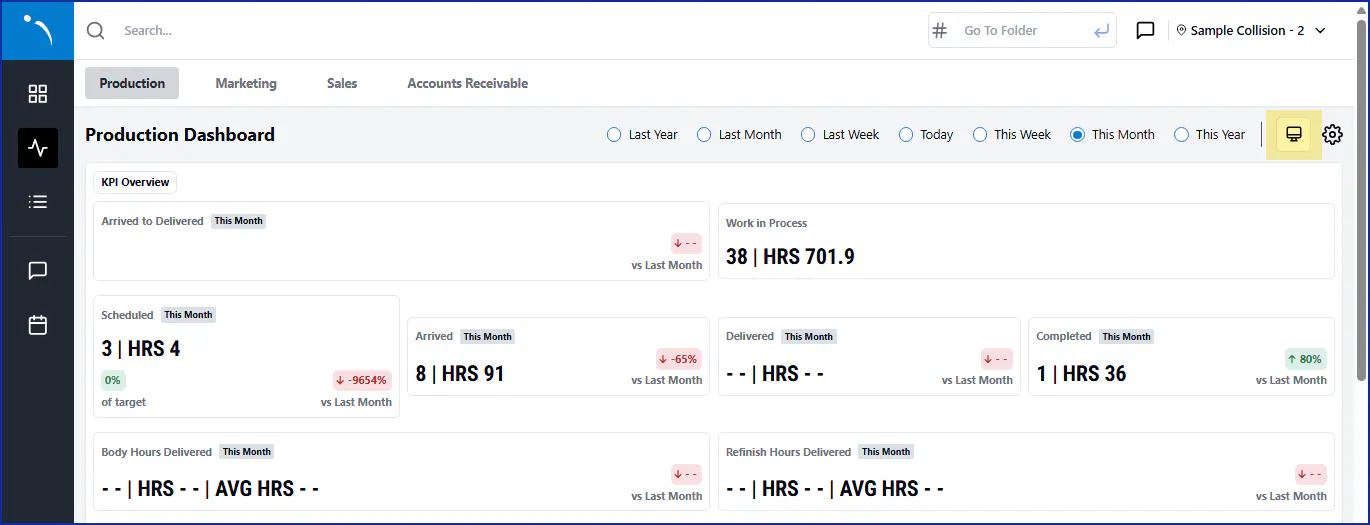
Section titled “What the dashboard shows”KPI Overview
- A. Arrived to Delivered: the cycle time of folders that moved from arrived to delivered in the time frame. A folder must have a disposition of Repair to be included in cycle time.
- B. Work in Process: based on work order hours, not estimate hours. Hours on manual work order lines aren’t included.
- C. Scheduled: repairs and hours scheduled in the time frame. The of target percentage is based on the schedule hours per day set in the location’s profile in Nexsyis.
- D. Arrived: the number of folders and hours that arrived.
- E. Delivered: the number of folders and hours delivered, based on work order hours.
- F. Completed: the number of vehicles and hours completed, based on work order hours.
- G. Body Hours Delivered: the number of folders with body hours, the hours delivered, and the average body hours of delivered repairs. vs Last Month compares the average hours.
- H. Refinish Hours Delivered: the number of folders with refinish hours, the hours delivered, and the average refinish hours of delivered repairs. vs Last Month compares the average hours.
Cycle time
- I. Cycle Time Averages: based on calendar days and estimate hours. Where cycle time starts is set by the stage chosen in the preferences setup in Nexsyis.
- J. Cycle Time by Resource - Arrived to Delivered: cycle time for each assigned service resource, with the longest and shortest cycle time.
- K. Cycle Time by Repair Stage: cycle time days in each repair stage.
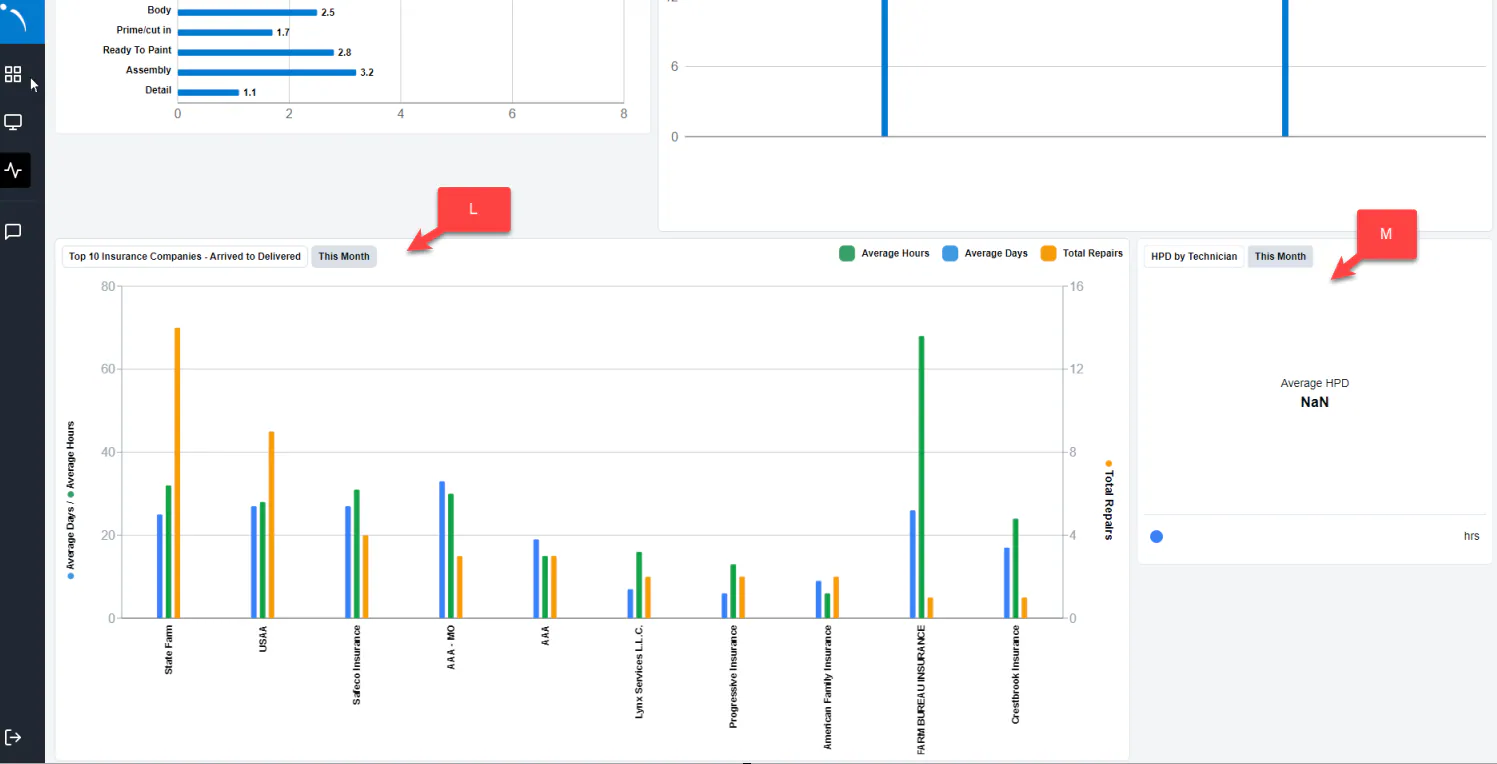
- L. Top 10 Insurance Companies - Arrived to Delivered: the ten insurance companies with the most repairs, from most to least, with average hours, average days and total repairs. Hover over the chart to see the numbers.
- M. HPD by Technician: average hours per day by technician.
Show or hide dashboard sections
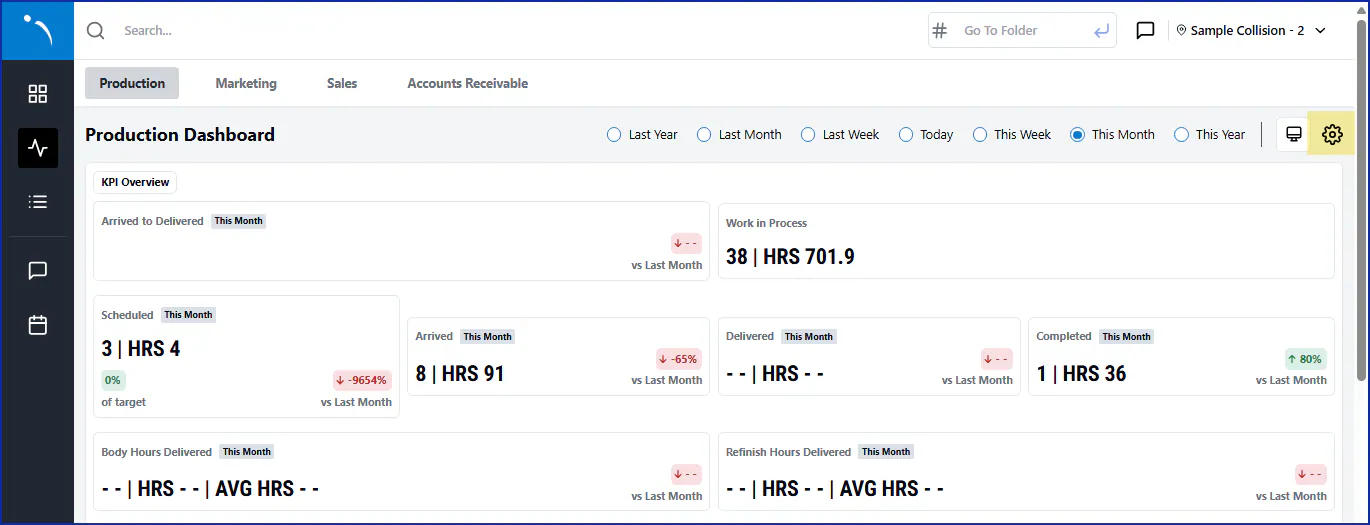
Section titled “Show or hide dashboard sections”Select the settings icon at the top right, then choose the sections to show or hide.
Show the dashboard in presentation mode
Section titled “Show the dashboard in presentation mode”Select the screen icon next to the settings icon. The dashboard opens in presentation mode and refreshes at the interval you choose.
View a previous period
Section titled “View a previous period”To see dashboard data for a past period, select Last Week, Last Month or Last Year, to the left of the current time frames.